
So you’ve knocked out an awesome Oracle APEX app in a record amount of time, because, you know: #lowcode. And as the old saying goes, if you build it, they will come.
In 2010, I built an application to try to get my 2 young boys reading. I admit at the time I was not concerned with performance, and it had a few juicy ‘select count(*) from huge table’ strategically (ahem!) sprinkled throughout.
Hey, my boys weren’t actually reading that much, so those tables were pretty small at the time…
Let’s just say I was pretty naive when I released it to the public, and never expected to be hit with thousands of users daily, generating 150,000 pageviews a day.
While I was very excited about all the interest, I was ill-prepared for the traffic. I was getting slammed with performance issues. Let’s just say that I became am avid student of Oracle APEX performance tuning, and thought I’d share some of things I have learned over the years.
Identify the bottleneck
There are many things you’ll want to look at when assessing your application’s performance. You’ll want to consider problems in the browser. Network issues. ORDS configuration. Database configuration, including possible missing indexes. Are there any database locks at play? Waits?
Once you feel sure your basic infrastructure is in good shape and not the culprit, it might be time to turn your attention to the application itself, meaning your front end (Javascript and CSS) and back end (SQL and PL/SQL).
1. Front end: order of files matters
First of all, if you are including custom CSS and JS components, make sure you put your CSS at the top of the page, and the JavaScript at the bottom.
This will ensure your users at least get the UI components, even if some slower loading business logic files have yet to load.
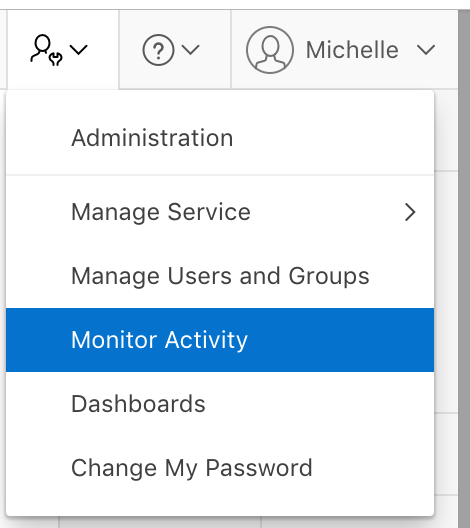
2. View the Activity Monitor
This is always a great place to start. If everything feels slow and you have no idea where to look, the Activity Monitor in your APEX Development environment can yield some precious information.
Every single page view across your workspaces and applications gets logged, with information about the user, date/timestamp, application, page_id, and most importantly, elapsed time.
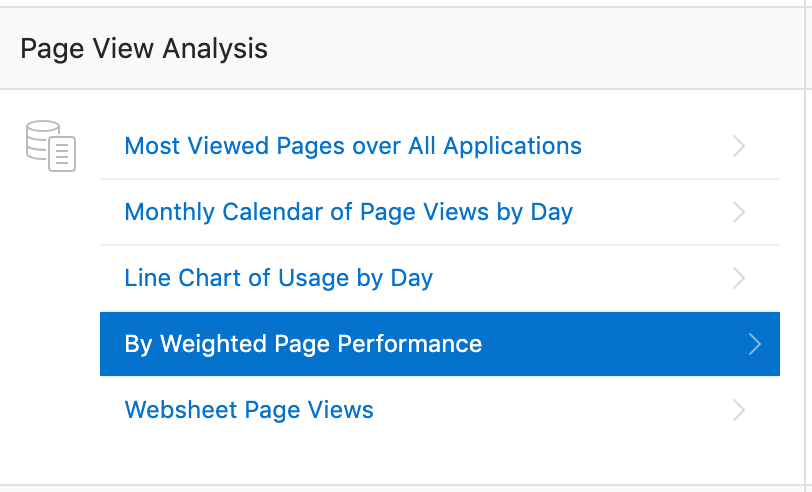
My favorite report is ‘By Weighted Page Performance’
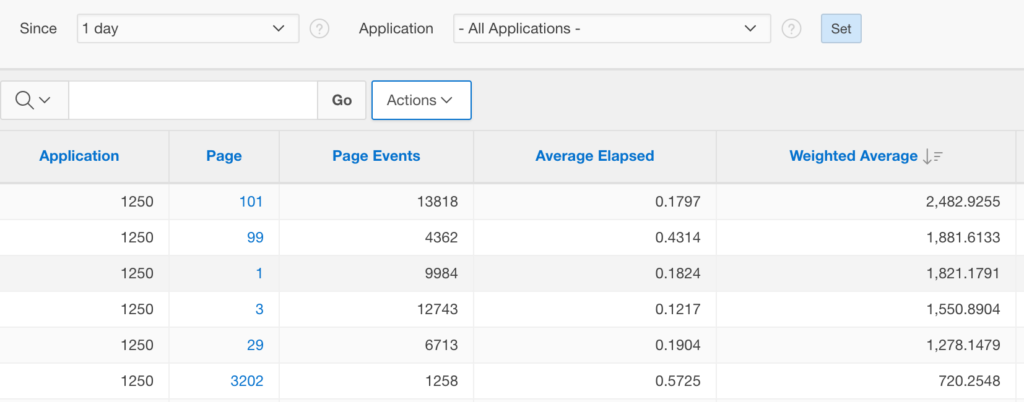
Pay close attention to any pages that have a large number of Page Events (meaning frequently accessed), and a high Average Elapsed Time. I seem to remember Joel Kallman once saying that anything above 0.5 seconds should be addressed. Of course, this is quite a generalization, and may or may not apply to your particular use case.
Activity Monitor gives you an easy IR to work with, but if you need a bit more detail, and want to run reports across workspaces, you can use the following query in SQL Developer to go as granular as you need to:
select workspace
      , application_name
      , application_id, page_id
      , count(*) total_page_events
      , avg(elapsed_time) avg_elapsed_time
      , sum(elapsed_time) elapsed_time
from apex_workspace_activity_log
where view_date between to_date('201911190900','RRRRMMDDHH24MISS') and to_date('201911191200','RRRRMMDDHH24MISS')
group by workspace, application_name, application_id, page_id
order by 6, 7 asc
3. #TIMING# substitution variable
Ok, so you may have found a slow page. Now what?
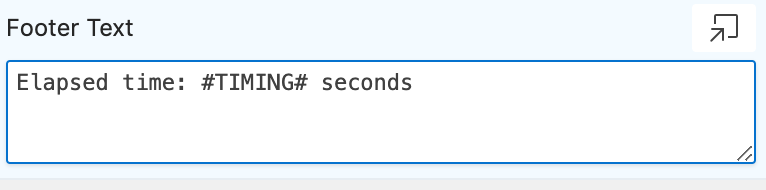
Well, you can use the #TIMING# substitution variable in the footer of your report regions if you want to get and display their elapsed time. This might help you identify any particularly slow report regions on your page that you can then turn your attention to. This is particularly useful on dashboard pages where you might have a lot going on.
Running the report will then yield:
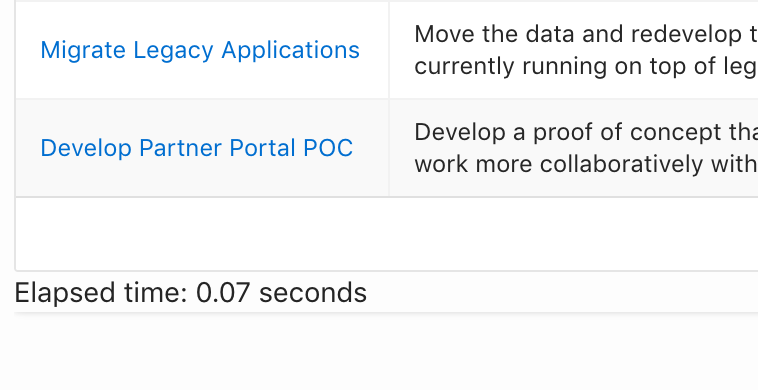
One thing I like about this feature is not necessarily that it identifies which regions take a long time to run (I can get that from my DEBUG window, see below), but it offers up information to the end users.
Oftentimes I find they will ask for data that I just KNOW will take forever to render. At least it gives me them a bit of a clue as to what might be going on and why they had to wait for their page a bit longer than expected.
4. Run your page in DEBUG mode
Even better, run it in Debug LEVEL9 to access your report’s explain plan.
The debug window will show you everything that is going on on your page, and show you execution time for every component. LEVEL9 will generate tons of rows, but you can sort by descending order of elapsed time to show you what, on your page, is taking the most time to render.
5. Beware of v(”) notation
If you have identified a poorly performing report, one thing you can check is if you may have used the v(”) notation when you could have used the bind variable.
select task_name
from tasks
where assigned_to=:APP_USER

vs

select task_name
from tasks
where assigned_to=v('APP_USER')
On a large table, the difference between the two statements can be huge, because the v(”) is actually a function call. This means that you will not be taking advantage of any indexes and the query will result in a full table scan.
Hint: if you need to refer to APEX session state in a view (where you cannot use bind variables), consider using a scalar subquery which can perform almost as well as your bind variable. See below.
select task_name
from tasks
where assigned_to = (select v('APP_USER') from dual)
Thanks to John Scott for suggesting this at one of the KScope (16? 17?) events I attended.
6. Avoid substitution strings in queries if you can
Beware of substitution strings in your queries.
Consider, for example, a situation where you might need a decode or case statement in your query to determine which page you want to branch to:
select case when dept_no=20 then
          'f?p=&APP_ID.:3:&SESSION.::::P3_DEPTNO:'||deptno
       else
          'f?p=&APP_ID.:2:&SESSION.::::P2_DEPTNO:'||deptno
       end as link
       , deptno
       , dname
from dept
Using the :SESSION bind variable rather than &SESSION. substitution string can make a huge difference and save Oracle a lot of parsing. The bind variable version allows Oracle to re-use the query.
select case when dept_no=20 then
          'f?p=&APP_ID.:3:'|| :SESSION ||'::::P3_DEPTNO:'||deptno
       else
          'f?p=&APP_ID.:2:'|| :SESSION ||'::::P2_DEPTNO:'||deptno
       end as link
       , deptno
       , dname
from dept
If you’re interested in learning more about this, check out Jorge Rimblas’ great video on Substitution Strings, Bind Variables, and APEX Links.
7. Use Declarative Options in your conditions when possible
When using conditions on page components, always use the declarative options when possible. They will be much more efficient.
8. Use report pagination settings wisely
On large reports, the pagination settings you choose can have significant impact. While there have been huge improvements in the way APEX handles pagination since version 18.1 (see this great post by Carsten Czarski), the ‘Row Ranges X to Y of Z’ setting in one you might want to turn off if you are having performance issues on a very large report.
9. Avoid HTML in your queries and use HTML Expression
When possible, use the HTML Expression attribute of your report columns to include any HTML/CSS attributes you might need.
10. Take advantage of Region Caching
So you’ve identified a really slow report region that you have tuned as much as you can.
Does the data need to be refreshed with every singe page view? Think of dashboard reports in particular, sales data, etc. Even transactional data from 1 minute ago might be good enough in many cases.
If so, you might want to take advantage of the Region Caching setting.
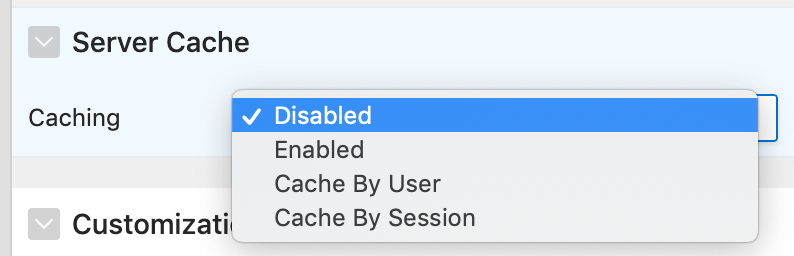
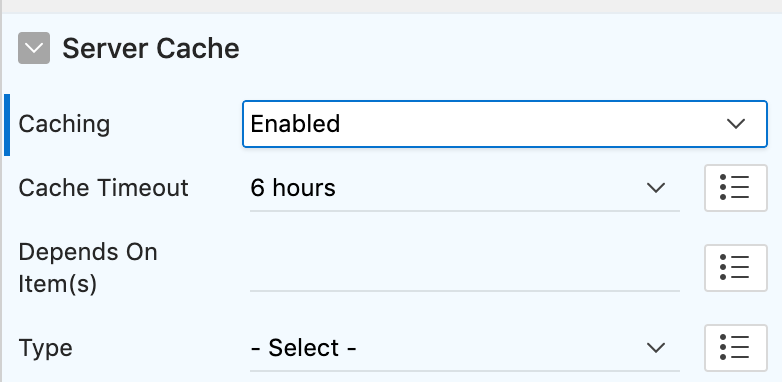
By default, caching is disabled, but if you enable it, you can select the cache timeout setting, from as little as 10 seconds. Even 10 seconds will help performance of a dashboard that is being hit by lots of users! And obviously upping this setting will help even more.
Careful, if you have sensitive data that varies by user, you might want to select ‘Cache by User’ or even ‘Cache By Session’ settings.
If you choose to enable caching, you might want to inform your users of the last time the data was refreshed. If so, you can use the APEX_UTIL.CACHE_GET_DATE_OF_REGION_CACHE function.
11. Move your PL/SQL to packages
Make sure you move your code to packages. These are already compiled in the database, and means less overhead on dynamic parsing.
Your page processes should simply be package calls when possible.
Steven Feuerstein wrote a very comprehensive article on writing PL/SQL for Oracle Application Express you might want to check out. It’s a few years old now, but still just as relevant!
12. Run the Advisor!
I don’t always see people using this great feature, but it’s something we all should be doing regularly. I am surprised every time at all the things it finds.
13. Use Build Options to turn components off and on
Ok, you have tried ALL THE THINGS, and still are stuck. If you are about to ‘start your page over’, something to consider is using build options on the different components of your page.
Don’t set their conditions to NEVER, or you’ll lose all your precious conditions! And components set to never have a nasty way of just living in your applications forever…
Create a new build option, using Status: Exclude.
Apply it to the different components of your page, one at a time. Run your page with each change and see if it runs any better. If your page suddenly runs faster, you may have found your culprits.
14. Understand how different IR settings can affect APEX performance
With a poorly performing Interactive Report, different settings, options or filters your users apply can amplify the badness (yes, that’s actually a word).
As mentioned before, the best place to start is by using your LEVEL9 debug mode and tune the REAL query. Study the explain plan, investigate indexes, tune where possible. Remember, every view (table, group by, chart, pivot) is a different query that might require tuning. It then changes again with the use of the search filter, or column header filter!
Your MaxRowCount setting also comes in to play, and it’s worth trying to make this as small as possible. There is no one, right answer to this, and you might need to play with different numbers before you get something that works for your users.
Basically, consider removing or changing some of the default behaviours. Developers have lots of control when it comes to what features are enabled for users. It is worth trying different settings out, and don’t forget to check with your users to make sure you’ve fully understood their requirements.
Finally, if you find your IR is still too slow, you might consider 2 alternatives:
- Pipelined Table Functions (select * from table (my_rpt_pipelined)) –> These can perform much better on complex queries.
- Creating your report on a collection (APEX_COLLECTION)
Thanks to Karen Cannell for these super helpful IR tips she presented at Kscope.. 17?
15. Tracing
When all else fails, you can add ‘&p_trace=YES’ to the end of your URL to generate a trace file you will then be able to analyze using the TKPROF utility.
More information on SQL tracing can be found here.
Still stuck? I’m always amazed at the responsiveness of the Oracle APEX community. Reach out, ask for help on the different forums or twittersphere, somebody is sure to point you in the right direction. I have had countless calls for help answered. You’ll find the answer! Just remember: it’s not APEX, it’s ….. you :-)
APEXionately yours,
Michelle
Expert Oracle APEX Development
Our team at Insum has dozens of experienced and certified Oracle APEX Developers to help you execute your projects. Reach out today!


And again a beautiful, very informative and usefull post with a funny twist.
Compliments to you Michelle
Thank you so much for the kind feedback, Jos!