Information overload occurs when the amount of input to a system exceeds its processing capacity.
We all have to deal with information overload every day. But it is our duty as developers to ease our users’ burden when it comes to presenting data.
If an icon or other visual cue will help with number processing, use it! When it comes to a statistic such as ‘percent complete’ or ‘progress’, give them a nice CSS Progress Bar that will help them immediately see where things stand with a quick, visual scan.
1. CSS you’ll need
You just need 2 little CSS classes to make the magic happen.
.progress-bar {
    display: -ms-flexbox;
    display: flex;
    -ms-flex-direction: column;
    flex-direction: column;
    -ms-flex-pack: center;
    justify-content: center;
    color: #fff;
    text-align: center;
    white-space: nowrap;
    background-color: #007bff;
    transition: width .6s ease;
}

.progress {
    display: -ms-flexbox;
    display: flex;
    height: 1rem;
    overflow: hidden;
    font-size: .75rem;
    background-color: #cfdae4;
    border-radius: .25rem;
}
2. Where to put the CSS
You have a few options here.
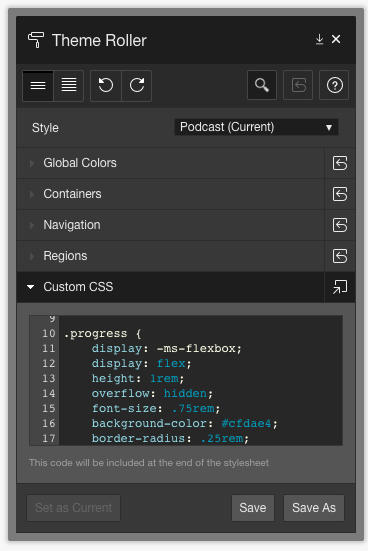
Universal Theme – Theme Roller
If you’re using the Universal Theme, simply pop out Theme Roller from your Developer Toolbar, and add it to the Custom CSS section
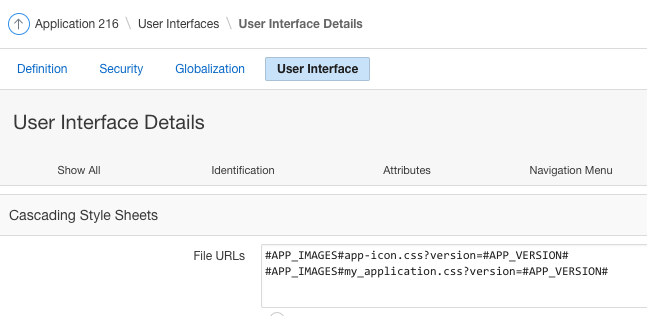
You can also link to an external CSS file in the Cascading Style Sheets section of your Application Attributes –> User Interface. These files can be external files that you reference with their full path, or file you have uploaded to your Application’s Static Files in Shared Components.
3. Use the CSS class in your reports
Again, there are multiple ways to do this.
HTML Expression
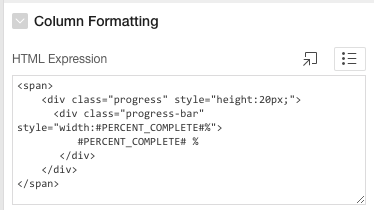
If you only need your Bootstrap Progress Bar in a single report, you can use the HTML Expression method in a Classic Report
Assuming you have a column in your query that is PERCENT_COMPLETE, you could put this in the corresponding column HTML expression field:
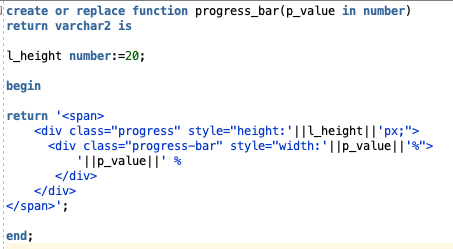
Function call in your query
If you need your progress bar in an Interactive Report, or you think you might want to render it in multiple places, it would be good practice to put this code in a package and call it in your query.
Sample function in a package called UTIL_PKG
Then your query would then look something like this:
select task_name
,start_date
,util_pkg.progress_bar(percent_complete) percent_complete
from task_table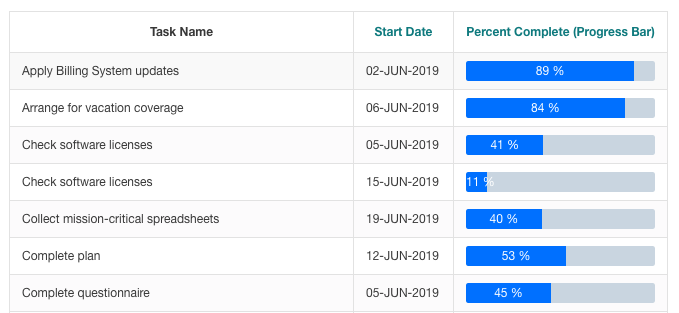
Tell me that isn’t a lot easier for your users to process than a bunch of numbers! A quick scan will show them which tasks still need attention
As developers, it’s sometimes too easy to forget about the little tricks that will make our end-users’ experience better.
It’s what makes the difference between an application that meets basic requirements, and an application that will knock their socks off!
APEXionately yours,
Michelle


Nice, thanks for sharing
Thank you! Appreciate the comment :-)
Thanks so much for sharing this wonderful blog..!
Thank you for your example.
Last year I also needed a progress bar in my report.
But it needed to be a bit more sophisticated.
Different colors depending on the percentage, toolbar text, text inside or outside the coloured part depending on the size, column sorting, etc…
Here is the thread that explains my version: https://community.oracle.com/thread/4187510
You can use it to extend your example if you like.
This is the function that I use:
/* This function can be used to have a percentage graph in your report.
p_value : The numeric value of the item. Will be used for sorting the column.
p_value_text : The text that will be shown in the percentage graph row.
p_other_value_text : The text that will be shown in the percentage graph row if there is no value (Optional).
p_color_class : The class name for the background color and text color of the bar in the column.
p_tooltip : The text that is shown in the tooltip when hovering the percentage graph row (Optional).
p_scale_percentage : The percentage value which will determine the size of the bar
p_width_column : The width of the column. Define this in Cell width attribute of the column or in the page inlin css:
For instance #PERC_GRAPH {width: 450px;}
p_size_digit : The size of a digit (default 8)
p_padding_left : To left pad the text in the percentage bar (Optional). This will overrule p_width_column and p_size_digit
The combination p_width_column and p_size_digit will determine whether or not the value text will fit in the colored bar.
If the (p_scale_percentage/100 * p_width_column) < length of the p_value * p_size_digit, then the value text will be placed
on the right side of the colored bar (padding left = p_scale_percentage/100 * p_width_column).
In this case the name of color_class will be extended with "_small", because in some cases the text color needs to be different
(black versus white). Test this functionality thoroughly to get the correct p_width_column and p_size_digit values.
*/
function apex_percentage_graph_column (p_value in number
,p_value_text in varchar2
,p_other_value_text in varchar2
,p_color_class in varchar2
,p_tooltip in varchar2
,p_scale_percentage in number
,p_width_column in number
,p_size_digit in number default 8
,p_padding_left in number default null
)
return varchar2
as
l_padding_left number;
begin
if p_padding_left is null
and p_width_column is not null
then
l_padding_left := round((nvl(p_scale_percentage,100)/100) * p_width_column);
end if;
return '’||chr(10)||
‘‘ || nvl(to_char(p_value,’FM000000000000000′),’No’) ||’‘||chr(10)|| — For sorting the column
‘<div class="a-Report-percentChart-fill '||p_color_class|| — Sets the background color and the text color
case — To use a different text color for the text when placed outside the colored bar, extend the class name with _small
when (nvl(p_scale_percentage,100)/100) * p_width_column ‘||trim(p_other_value_text) — No value shown
when p_padding_left is not null — Overrule the width column and size digit option
then ‘text-align:right; padding-left:’ || round (p_padding_left) || ‘px; “>’||trim(p_value_text)
when l_padding_left ‘||’ ’||trim(p_value_text)
else — Place the value text in the colored bar
‘text-align:right; padding-right:6px;”>’||trim(p_value_text)
end ||”||
‘‘ || to_char(p_value) ||’‘; — Internal span
end apex_percentage_graph_column;
Thank you so much for your comment and I will absolutely incorporate at least some of these features in mine, particularly the colour. Thank you for sharing, Mathieu!
Thanks for Sharing Michelle. Just one minor comment. The progress-bar class has an ending bracket missing }. For the “copy pasta” guys like me it makes a difference :)
Yes of course, and thank you so much! Corrected :-)